A directional decision is imminent for Bitcoin

In view of the difficult situation on the global financial markets, the Bitcoin course (BTC) is still holding up bravely. Which price markers will be relevant for investors in the short term? In the course analysis.
Bitcoin (BTC): The bulls still won’t give up on bitcoin
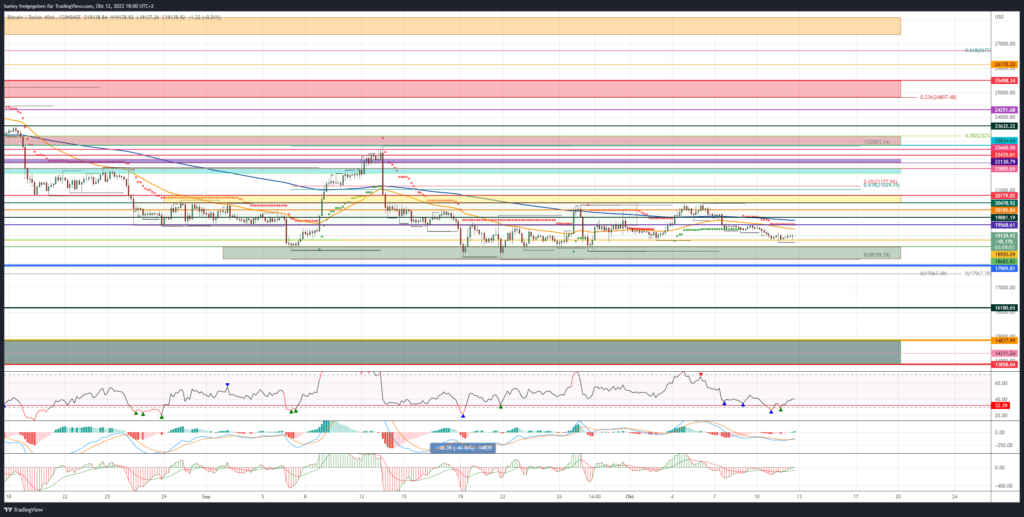
BTC rate : $19,139 (previous week: $20,187)
Short -term resistances/goals: $ 19,881, 20,185 USD , 20,478 USD, 21.029/21,177 USD, 21,691/21,892 USD, 22,435 USD, 22.834 USD, 23.632 USD, 24.291, 24.814 , $25,498, $26,170, $26,734, $27,696/$28,104, $28,607
Short-term supports: $18,950, $18,683/18,159, $17,909/17,567, $16,180, $14,838, $14,311, $13,858
Recap Bitcoin
- The price of the key cryptocurrency Bitcoin is still able to hold its own despite ongoing problems on the classic financial market.
- While the major US stock indices corrected to new annual lows in the last few trading days and the US dollar index DXY continues to range in the area of its annual high, the Bitcoin price initially successfully stabilized above the important support of USD 18,950.
- This means that the BTC price is almost nine percent above its low for the year so far.
- As a result of the massive devaluation of many fiat currencies such as the euro or the pound sterling, investors increasingly invested in Bitcoin again at the end of September with the aim of protecting themselves against the ongoing depreciation of their national currencies.
Bitcoin is proving increasingly resilient to weakness in the stock market
- Even the US producer prices, which rose more than experts expected on Wednesday afternoon, did not lead to a sell-off on the crypto market.
- Investors seem to be waiting for the inflation data expected from the US tomorrow, Thursday. This is the only way to explain the relatively low volatility on the financial markets.
- The fact that Bitcoin is becoming increasingly resilient to negative economic news underlines the outperformance of the key crypto currency compared to the classic stock market.
- As long as Bitcoin is able to maintain its daily closing price above USD 18,950 and, in particular, does not correct sustainably below the support at USD 18,683, the bulls will continue to do everything in their power to promptly move the BTC price back towards last weekend’s high of USD 19,568.
- If the US consumer price index falls more than market observers suspect, a recovery can be expected on the classic stock market and primarily on the crypto market.
- Investors also need to keep a close eye on the US Dollar Index. Only when this forms a new high for the year will the pressure on the Bitcoin price increase again.
- As always, investors can read in the current overview article which dates will also be relevant for the price of Bitcoin in addition to the fresh inflation data .
- It is also important to monitor the trading volume of bitcoin. Only when the Bitcoin price can increase in value with increasing trading volume, the price increase should also be of a sustainable nature.
A look at the indicators
- With a value of 20, the Fear and Greed Index is still in the “extreme fear” range, but has recently been able to stabilize at this low level and has not slipped back towards its lows for the year.
- Looking at the RSI and MACD indicators, the 4-hour chart shows clear oversold states. In addition, a bullish divergence is forming here. In the daily chart, however, both indicators have generated sell signals, which could result in a renewed sell-off if the daily closing price is below USD 18,683.
- The buyer side must therefore do everything in the short term to stabilize Bitcoin again above USD 19,881 in the near future.
- A clearer chart brightening for Bitcoin can only be expected when it stabilizes above the red resistance zone between USD 20,478 and USD 20,779.
- If the bulls succeed in pushing BTC price above this resist area, the cryptocurrency could extend its recovery move to the golden pocket between USD 21,029 and USD 21,177. Only when this resistance zone is recaptured should we look towards the next target at USD 21,892.
Bullish Scenario (BTC)
- Although Bitcoin is trading at a price just above USD 19,000, a good five percent lower than last Wednesday, in view of the new annual lows in the Nasdaq technology index, this can still be viewed positively.
- If the bulls can defend the support at USD 18,950 and promptly heave the BTC price back above the resistance at USD 19,568, this would be a first strong sign from the buyer side. If this breakout succeeds, Bitcoin would overcome the supertrend in the 4-hour chart and thus target the next price target at USD 19,881.
- If this resistance is also broken, investors will focus on the next resist at USD 20,185.
- In order to confirm the upward movement, it is also necessary to break through the previous week’s high of USD 20,478.
- A break above this strong resistance will immediately send BTC price higher towards USD 20,779. The super trend in the daily chart is also running here at the moment.
Bitcoin course: “Golden Pocket” crucial
- If Bitcoin does not turn south again here and jumps further north over this resistance at the daily closing price, the Golden Pocket comes into the eyes of investors.
- The first profit-taking is to be planned for around USD 21,100.
- If the bounce back above this resist area, the bulls will need to stay on the trigger and quickly buy bitcoin up towards the $21,691-$21,892 turquoise resistance zone.
- Only if the buyer camp manages to stabilize the Bitcoin price above the turquoise resistance zone with increasing trading volume does the probability of a subsequent movement in the direction of the purple resistance area increase.
- If Bitcoin can then dynamically break through USD 22,130 and the resistance at USD 22,435, a directional decision should be planned at USD 22,834 at the latest.
- Only when the Bitcoin price can pulverize the multiple resistance area of horizontal resist and 38 Fibonacci retracement of the entire downward path at USD 23,244 will further price targets at USD 23,632 and in particular USD 24,291 be activated.
The chart picture is getting brighter and brighter
- Should the buyer camp also be able to dynamically break through this resistance level in the coming weeks, the recovery will extend to USD 24,814. As in August, clear resistance from sellers is to be expected here.
- The 23 Fibonacci retracement of the complete downward movement, which is located here, could not be recaptured in the long term.
- However, this strong resistance must be breached in the long term in order to release further upside potential.
- If Bitcoin then also overcomes the historical high of USD 25,214 at the daily closing price, a march through to USD 26,170 cannot be ruled out.
- A preliminary decision for the coming period can still be expected at the 61 Fibonacci retracement at USD 26,734.
- Only when this strong resistance level can also be overcome will there be room for a jump towards USD 28,000.
Bearish Scenario (BTC)
- Although the bears managed to sell the BTC price back below the psychologically important support level of USD 20,000 in the previous week, the bulls have so far been able to fend off a break in the strong support at USD 18,950.
- So far, the seller camp has failed in an attempt to push the BTC price back towards the yearly low.
- However, the sell-side must push BTC price back below this support level to activate the next bearish target at $18,683.
- If this support is also breached, a directional decision will be made at the lower edge of the green support zone.
- If the seller succeeds in selling the Bitcoin price below USD 18,159, the chart picture will become even cloudier.
- If Bitcoin then slips below the support at USD 17,909, a retest of the yearly low at USD 17,567 is increasingly likely.
- If Bitcoin does not turn back north for a long time and forms a new year low, the price correction will expand directly towards the next support at USD 16,180.
- The probability of a correction up to the repeatedly mentioned bearish target zone between USD 14,837 and USD 13,858 then increases further.
Disclaimer: The price estimates presented on this page do not represent buy or sell recommendations. They are merely an assessment by the analyst.